
Guides
Installing the Kinference Grafana dashboards
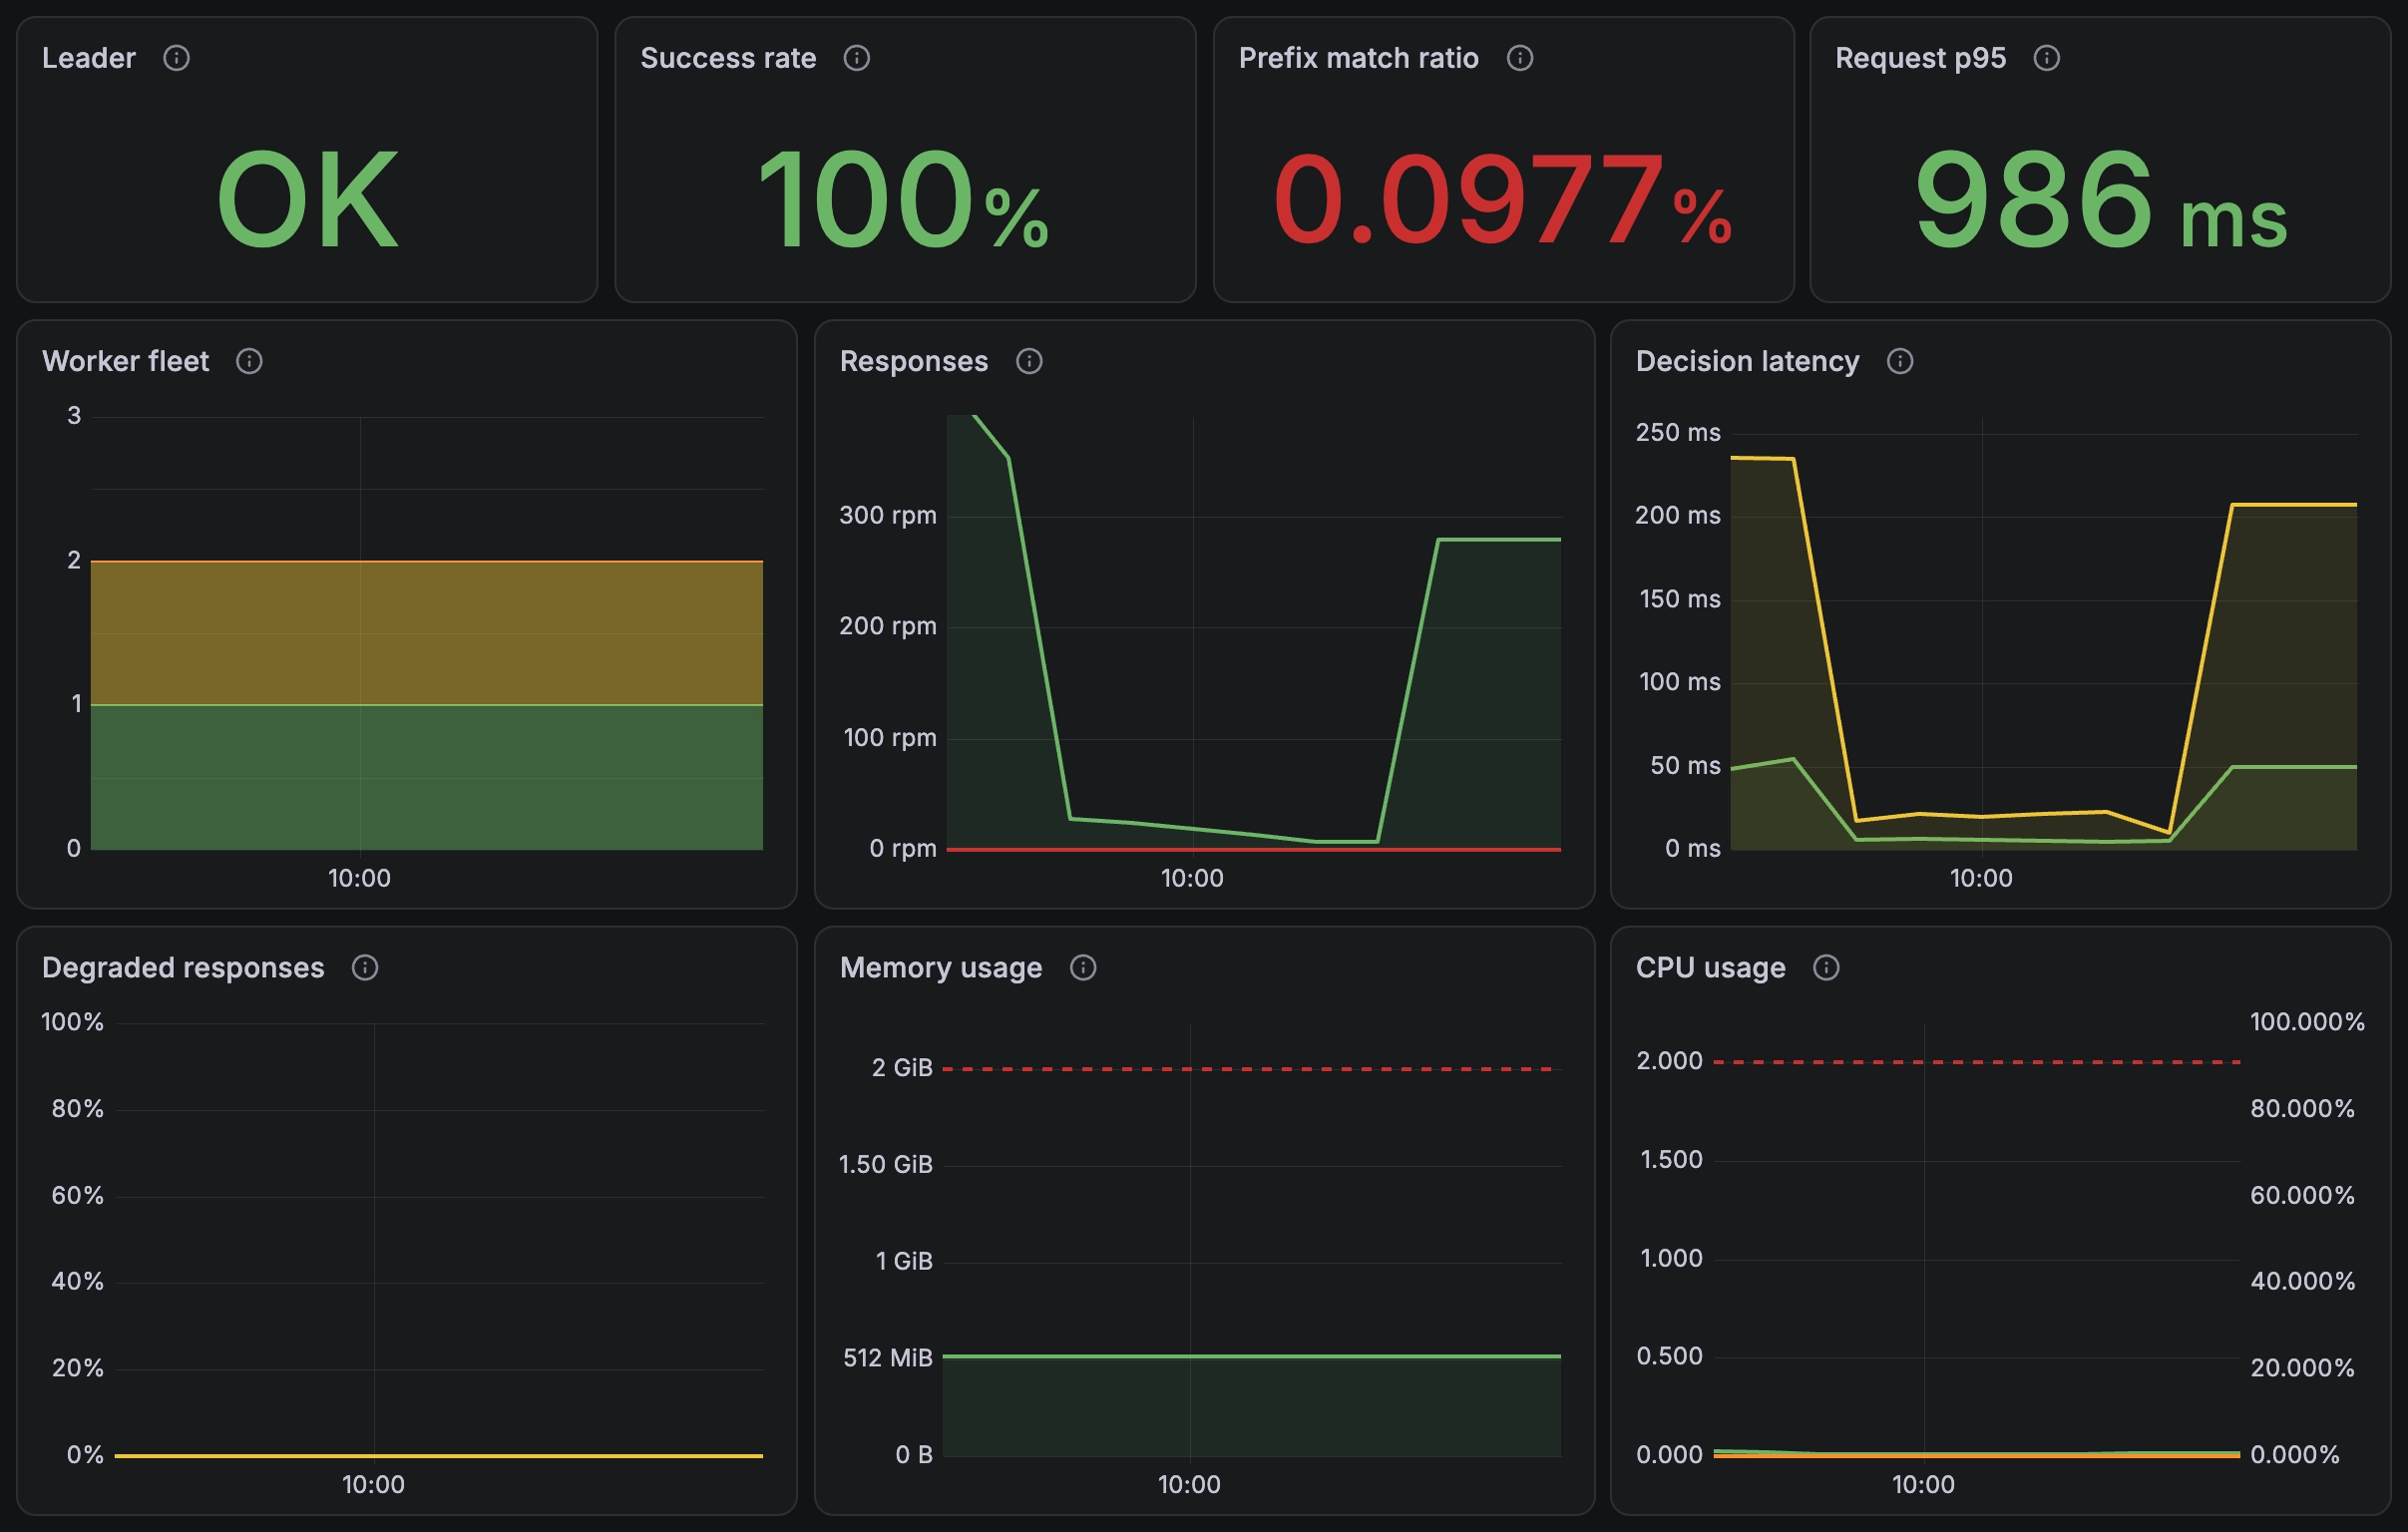
Kinference exports a complete set of metrics in a Prometheus-compatible form. It also ships with a fully-featured Grafana dashboard that provides an out-of-the-box operational view of the state of your Kinference deployment.
In this guide, we’ll show you how to populate these dashboards with data.
Prerequisites #
We’ll assume you have already installed Kinference. If you haven’t, see the Getting started guide.
Option 1: With kube-prometheus-stack #
The Kinference Grafana dashboards require a Grafana instance running on the cluster. Typically, this Grafana instance is powered by a Prometheus-compatible metrics store, which may be Prometheus itself or alternatives such as VictoriaMetrics.
On a production cluster, it is likely that this stack already exists. See With an existing metrics stack below.
If this is a fresh cluster, one easy option to fulfill this requirement is to install kube-prometheus-stack:
helm upgrade -i kube-prometheus-stack oci://ghcr.io/prometheus-community/charts/kube-prometheus-stack -n monitoring --create-namespace --set grafana.sidecar.dashboards.searchNamespace=ALL --set prometheus.prometheusSpec.podMonitorSelectorNilUsesHelmValues=false --waitNow that KPS is installed, we need to enable PodMonitor and the Grafana dashboards in Kinference:
helm upgrade -i kinference oci://cr.kinference.ai/kinference-ai/charts/kinference --devel --set extension.enabled=true --set podMonitor.enabled=true --set grafanaDashboard.enabled=true --waitWith that, data will automatically be collected by KPS and made available to the Kinference dashboards. To see the dashboards, first get the admin password with:
kubectl -n monitoring get secret kube-prometheus-stack-grafana -o jsonpath='{.data.admin-password}' | base64 -d;echoThen set up the port-forward:
kubectl -n monitoring port-forward svc/kube-prometheus-stack-grafana 3000:80Now you should be able to go to http://localhost:3000 and sign in as admin with the password above. Navigate to the “Kinference Control Plane Overview” dashboard. As Kinference serves inference traffic, these graphs should to populate.
Option 2: With an existing metrics stack #
The full scope of possible Prometheus-compatible metrics stacks and configurations is vast. This section is intended as general guidance for navigating this landscape.
For Kinference to be monitored and the Grafana graphs to be populated, three things need to happen, one way or another:
- Every kinference pod must be scraped on :9001/metrics. For convenience, these
pods all have the
app.kubernetes.io/name: kinferencelabel. - The metrics scraper must put
namespaceandpodlabels on the series. - The JSON in Grafana must be pointed at a Prometheus-compatible datasource.
Note that the CPU and memory panels also need cAdvisor and kube-state-metrics series; if these are not present, these panels will not populate.
If you’re using the Prometheus operator, then as long as your Prometheus
podMonitorSelector and podMonitorNamespaceSelector match Kinference’s
PodMonitor, this setup will likely work as is. You need only enable the
podMonitor and grafanaDashboard flags in Kinference:
helm upgrade -i kinference oci://cr.kinference.ai/kinference-ai/charts/kinference --devel --set extension.enabled=true --set podMonitor.enabled=true --set grafanaDashboard.enabled=true --waitIf you’re using “plain” Prometheus, you may likely a manual scrape config along the lines of:
- job_name: kinference
  scrape_interval: 10s
  kubernetes_sd_configs:
    - role: pod
  relabel_configs:
    - source_labels: [__meta_kubernetes_pod_label_app_kubernetes_io_name]
      regex: kinference
      action: keep
    - source_labels: [__meta_kubernetes_pod_container_port_name]
      regex: dashboard
      action: keep
    - source_labels: [__meta_kubernetes_namespace]
      target_label: namespace
    - source_labels: [__meta_kubernetes_pod_name]
      target_label: pod
For Grafana, if you’re using the dashboard sidecar (e.g. the standalone grafana
Helm chart): ensure grafanaDashboard is enabled in Kinference, and that the
sidecar watches the label grafana_dashboard and Kinference’s namespace.
If you’re using the Grafana operator, ensure grafanaDashboard is enabled in
Kinference, then point a GrafanaDashboard at the ConfigMap, changing
instanceSelector to match your Grafana resource. For exampoe:
apiVersion: grafana.integreatly.org/v1beta1
kind: GrafanaDashboard
metadata:
  name: kinference
spec:
  instanceSelector:
    matchLabels:
      dashboards: grafana
  configMapRef:
    name: kinference-grafana-dashboard
    key: kinference-dashboard.json
The “nuclear option” is to simple extract the JSON from the Kinference artifact directly:
helm pull oci://cr.kinference.ai/kinference-ai/charts/kinference --devel --untarThen import kinference/dashboards/kinference-dashboard.json into your Grafana-compatible system.